In the State of the Union speech last month, President Trump touted a “blue collar boom” that has benefited those at the bottom of the economic ladder. But a new analysis of U.S. Census data paints a different picture, showing how the poorest of the poor fared during the first two years of his presidency, a period of slowing income growth for the nation’s neediest households.
Also Read: “When a Higher Wage Is Not Enough”
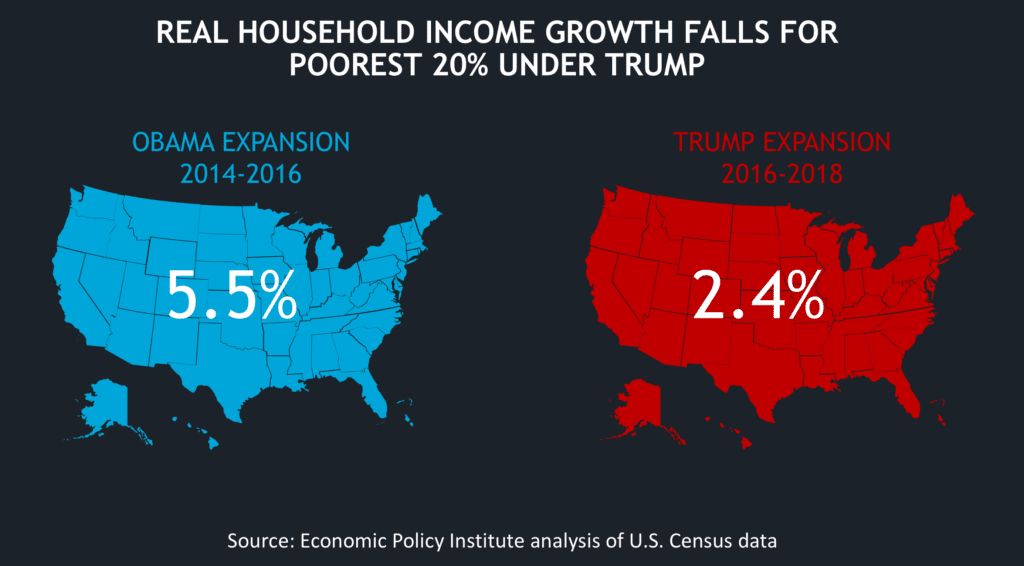
Inflation-adjusted income grew more haltingly for national households as a whole and for poor households in 36 states during Trump’s first two years when compared to the previous two years. Low-income households — with average incomes of about $14,000 a year — saw their inflation-adjusted incomes rise 2.4 percent while they grew more than twice as fast, at 5.5 percent, during the last two years of the Obama administration.
“This far into an expansion, with unemployment as low as it is, we shouldn’t be seeing incomes for low-income households falling in over a dozen states, and growth slowing down in a dozen more,” says Thea Lee, president of the Economic Policy Institute, which conducted the analysis in partnership with Capital & Main. “Stock market highs may be great for wealthy households at the top, but they don’t help families at the bottom put food on the table.”
Our analysis compares two periods of economic expansion: Obama’s last two years in office (2015 and 2016) to the first two years of the Trump presidency (2017 and 2018). In each case, the income reported in the prior years (2014 and 2016) serve as base years that allow us to measure growth over the subsequent years.
In the maps below, the “Obama expansion” is described as “2014-2016” and the “Trump expansion” is described as “2016-2018.”
In eight of the 10 states where the presidential race was decided by less than 4 percent in 2016, the poorest households experienced slower income growth under Trump than under Obama. The eight include New Hampshire, Maine, Pennsylvania, Minnesota, Florida, Nevada, Michigan, and Wisconsin. (Income is defined as wages, investment returns, social security and retirement payments, as well as cash assistance programs from the government.)
North Carolina and Arizona are swing states that bucked the trend and saw faster growth for the poorest 20 percent of households during Trump’s first two years in office than during the prior two years. Arizona’s delayed recovery — and the boost in its minimum wage in 2017 — could explain the faster income growth from 2016 through 2018, according to David Cooper, a senior policy analyst at the Economic Policy Institute, who led analysis of U.S. Census data in collaboration with Capital & Main.
In North Carolina, a state with a large minority population, the recent speed-up in growth could have a demographic explanation, says Cooper. More than one-fifth of North Carolina residents are African-American, a population that is historically the last to benefit from an economic expansion. In this case, the state could finally be experiencing the benefits of the recovery that began under the Obama administration.
In 13 states, the poorest households saw a decline in their buying power under Trump, compared to six states and the District of Columbia during the last two years of the Obama administration.
* * *
It’s true that nationally wages have begun to grow faster for those at the bottom over this past year, and that could bode well for income growth in 2019 when those figures become available. In 2019, the average low wage worker saw a 2.9 percent increase in their hourly wages, from $9.54 to $9.82. Between 2014 and 2018, wage growth has been relatively flat, growing at an average rate of just 1.4 percent per year. But for low wage workers, such a boost — $48.50 a month if one assumes full time work — is hardly transformative.
“None of this speaks to the quality of jobs, the long-term sustainability of them, whether they support particularly tolerable lives,” says Mark Muro, a senior policy fellow at the Brookings Institute.
Over the past several decades, the U.S. economy has been doing an increasingly poor job of creating good jobs, a trend made clear with a job quality index released in December by researchers from the Cornell University Law School, the Coalition for a Prosperous America, the University of Missouri-Kansas City, and the Global Institute for Sustainable Prosperity.
The index, which is essentially a ratio of nonmanagerial “high quality jobs” in the private sector (jobs which have higher wages and more hours per week) and “low quality jobs” (ones that pay less and offer fewer hours), reveals an overall decline in quality since the 1990s with some ups and downs that track the business cycle.
But Trump’s recovery has trended toward creating more poor jobs relative to good jobs than did the Obama recovery. In January 2017, when Trump took office, the economy was creating 85 high quality jobs for every 100 low quality ones, still below the pre-recession high of 90 good jobs for every 100 low quality ones. Since January 2018, when the 2017 Tax Cut and Jobs Act took effect, the monthly index has trended downward despite the tighter labor market, hovering between 80 and 83 high quality jobs for every 100 bad ones.
“At least under Obama, we saw some improvement” in job quality, resulting from the “funding of infrastructure and other things that can actually create high quality employment,” says Daniel Alpert, a founding partner of Westwood Capital LLC and an architect of the job quality index.
The Trump administration has credited its agenda of tax cuts and deregulation with unleashing the private sector and stimulating the economy. “It can no longer be denied that some of the biggest beneficiaries are Americans who have been disadvantaged historically,” boasted a press release accompanying the release of the U.S. Census data on income.

But those who have tracked the aftermath of the tax cuts see little evidence that it created more than a short-term stimulus that largely benefitted higher wage earners and the wealthy.
Alpert says that what spending there was largely went to investments like pharmaceutical patents, media content, and communications equipment, not the factories that would create jobs. “The Trump administration, for all its bluster about tariffs and things it said it was going to do, hasn’t delivered at all,” says Alpert, who also teaches at Cornell Law School.
On the other hand, increases in the minimum wage have made a difference to low wage workers since the recession ended. Those workers in 26 states that raised their minimum wage have seen an increase in their real hourly pay since 2013, while those in the other 24 states have seen their real pay fall, according to a National Employment Law Project study, USA Today reported.
“A decade of gradually improving labor markets, combined with states and cities raising their minimum wages, has brought some improvements,” says the Economic Policy Institute’s Lee.
Copyright Capital & Main


