
Hate Crime Watch
Interactive Map: California Hate Crimes Rise 17 Percent
California has 75 hate groups, the largest concentration of hate groups in the nation. A new report gives a breakdown of hate crimes reported in the state last year.
A report released by the California Department of Justice documents a 17.4 percent increase in the number of hate crime events reported in 2017. The survey shows an increase from 931 hate crime events in 2016, to 1,093 in 2017.
Other takeaways from the “Hate Crime in California” report:
Hate crime events involving a racial bias increased 16 percent — from 519 in 2016, to 602 in 2017.
- Anti-black or African-American bias events rose from 251 in 2016 to 302 in 2017, an increase of 20.3 percent.
- Anti-Hispanic or Latino bias events rose from 83 in 2016 to 126 in 2017, an increase of 51.8 percent.
Hate crime events involving religious bias increased 21.1 percent — from 171 in 2016, to 207 in 2017.
- Anti-Jewish bias events rose from 82 in 2016, to 104 in 2017, an increase of 26.8 percent.
- Anti-Islamic (Muslim) bias events rose from 37 in 2016, to 46 in 2017.
Hate crime events involving a sexual orientation bias increased 18.8 percent — from 207 in 2016, to 246 in 2017.
- Anti-gay (male) bias events rose from 152 in 2016 to 172 in 2017, an increase of 13.2 percent.
California has 75 hate groups, the largest concentration of hate groups in the nation. According to the Southern Poverty Law Center, the number of hate groups rose nationally from 917 in 2016, to 954 in 2017.
View our map below that shows the hate crime events for the last three years by county.
Copyright Capital & Main


-

 Column - State of InequalityMay 21, 2026
In California Governor’s Race, Xavier Becerra Walks Away From Single-Payer
-

 Latest NewsMay 22, 2026
Where California’s Gubernatorial Candidates Stand on Climate and Taking Big Oil Money
-
 The SlickMay 20, 2026
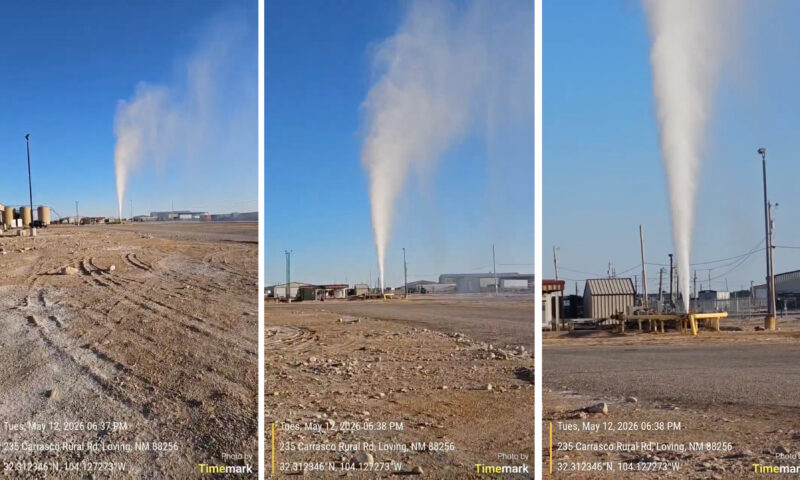
70-Foot Wastewater Geyser Reflects New Mexico’s Latest Oilfield Challenge
-
 The SlickMay 29, 2026
Feds to Open Tens of Thousands of Acres of Colorado Wilderness to Oil Drilling
-
 Latest NewsMay 18, 2026
Budget Cuts Threaten Program That Doubles Food Dollars for Californians in Need
-
 Deadly Dust: The Silicosis EpidemicMay 27, 2026
California Moves to Ban Quartz Countertop Fabrication to Combat Silicosis Epidemic
-
 Latest NewsMay 26, 2026
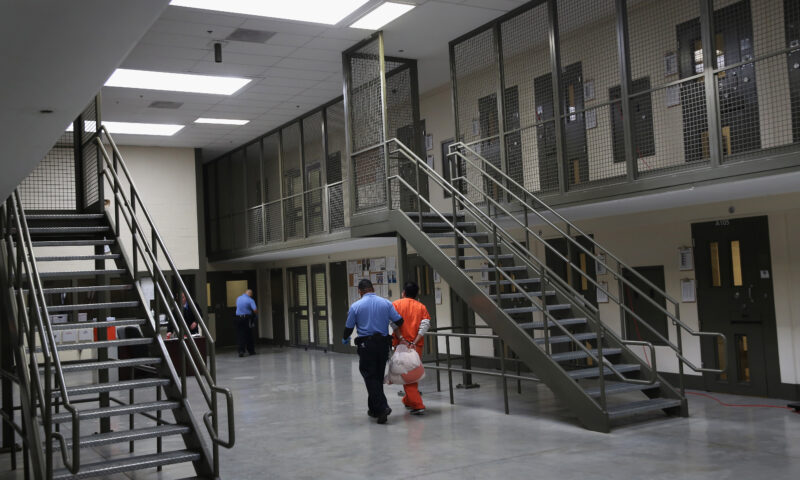
Conditions at California ICE Detention Centers Are Getting Worse, Inspections Find
-
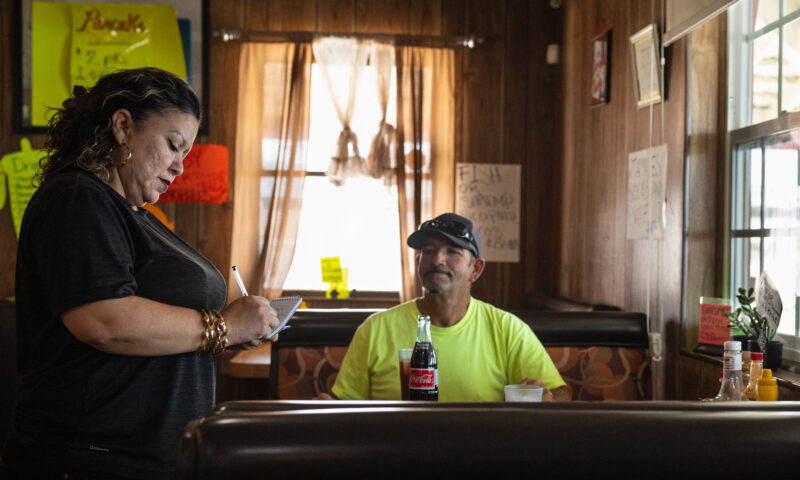
 Imperial DivideJune 3, 2026
California’s Lithium Valley Dreams Meet Reality at the Only Restaurant in Town