
Labor & Economy
The Real Costs of Living in California
A new report from United Ways of California shows that 1 in 3 working families struggle to make ends meet.

These seem to be boom times for Americans, as monthly statistics from the U.S. Labor Department tout a fast-rising economy and dwindling unemployment since the final years of the Obama administration. What those numbers fail to measure is the real cost of making ends meet, and how far out of reach that remains for many working households that continue to struggle.
The reality in California is that one in three households are falling short, according to Struggling to Stay Afloat: The Real Cost Measure in California 2018, a new report from the nonprofit United Ways of California. The study sought to document the actual costs of a “a bare-bones decent standard of living,” says Peter Manzo, president of the nonpartisan advocacy group, and include the real-world impact of housing costs, transportation, education and other immovable factors.
The report is downloadable from the United Ways website, which also has interactive features where each county is examined in detail. In an interview with Capital & Main this week, Manzo explained the report’s findings.
Captial & Main: What inspired this study?
Peter Manzo: The federal poverty level doesn’t really take into account the cost of living in California. It also doesn’t tell you where we would like families to be. It doesn’t show you what is doing OK and how far most households are from it. Everyone knows it can be expensive to live in California, but this adds more detail.
How did you determine what the real costs were?
The real cost measure we used is a basic needs budget: housing, food, transportation, health care, childcare, taxes and 10 percent of the total for miscellaneous – things like your mobile phone bill. The interesting thing about the real cost measure is that the household budget varies by composition. So if you have two adults working full-time minimum-wage jobs, the household budget was different from the same two adults with an infant. The cost structure changes significantly by adding family members.
It looks like different parts of the state are affected differently.
Obviously, coastal areas are more expensive to live in than inland areas in terms of housing. Even so, there are high numbers of households struggling to meet the cost of a decent standard of living in those lower-cost areas. It’s interesting to contrast much of the Bay Area with L.A. County, which has a much higher rate of struggling households: 38 percent of households in L.A. County struggle vs. the composite number across those Bay Area counties, which is about 25 percent. It’s very expensive to live in Santa Clara County, but there are more households that are earning above what they need.
If you look at Fresno County, that’s a very different situation.
On our website, you can look at neighborhood level data. You can look at it by neighborhood, which is real important. With Fresno, you have a high rate of need. And if you look at West Fresno, which sadly is pretty well known for having a very high unemployment rate and a lot of struggling families, it looks worse than other parts of Fresno.
In the Bay Area there is more opportunity, while in Fresno County the opportunities are less and people are struggling at a higher rate than other parts of the state.
Yes. It’s very tough in a lot of place in the Central Valley and the Inland Empire. There are struggling households in just about every part of the state. Every ethnic and racial group struggles. No one’s immune to it.
The Bay Area has been going through a difficult boom period where a lot of people moved in and housing costs went up. L.A. seems to be in the middle of that too. How do those kinds of changes affect people’s ability to keep up?
HUD fair market rent, which is a proxy for actual rents, increased almost 45 percent in the last three years in Alameda County. That’s a steep jump. The Bay Area cost ripple is still going on. L.A. County has rising rents. Our offices are in Downtown L.A., and you can’t turn around without bumping into a crane. In the last three years, there has been an incredible boom in construction. And it seems to be mostly high-market condos that aren’t very affordable and aren’t that well occupied. My sense is that people are buying them for a second home. Obviously we need more housing units, but they need to be affordable. What we want to point out in our study is that we need to do more for renters. There are many more people living in apartments whose rents may go up than would be housed by new construction. Maintaining affordability is key.
How does education play into it?
We see a correlation between a higher level of education and a lower rate of struggle. Households led by college graduates, only 15 percent of those households struggle, compared to 78 percent for households led by somebody who doesn’t have a high school diploma.
How do children in a household affect the ability to keep up?
That’s one of our big findings. A household with kids really changes the budget of what a decent standard of living looks like. Some people would quarrel with us about this, but we feel children should have access to quality pre-school and childcare. We know most kids don’t actually get access to that, but we think they should, and that’s included in our budget. We find that 6 in 10 households with a child under 6 are struggling – especially when they’re led by a single mother.
It looks like in many parts of the state, transportation is also a big cost, approaching the level that people pay for housing.
Our assumption is that families need a car. We talk to people who do studies back east, and often the assumption there is that low-income households are using public transportation. But even in the Bay Area, most people need a car. It’s like a lifeline, to drive around and get to work. It’s a little like Grapes of Wrath: You need to be able to move. Our costs are based on reported expenditures from the Bureau of Labor Statistics. If we had a high functioning public transportation system down here, that would help a lot of people.
These are overwhelmingly working households: 9 in 10 of them have a working adult, and in 80 percent of them the household is working full-time. Oftentimes, when people talk about poverty, they just know what the poverty level is – but it doesn’t really tell you what they’re contending with, and the trade-offs they’re having to make. And there’s often an assumption that poor people are lazy and if they just get a job, things would be better. Our point is that these are overwhelmingly working families. They have jobs and they’re still not earning enough for a decent standard of living.


-

 Column - State of InequalityMay 21, 2026
In California Governor’s Race, Xavier Becerra Walks Away From Single-Payer
-

 Latest NewsMay 22, 2026
Where California’s Gubernatorial Candidates Stand on Climate and Taking Big Oil Money
-

 The SlickMay 20, 2026
70-Foot Wastewater Geyser Reflects New Mexico’s Latest Oilfield Challenge
-

 The SlickMay 29, 2026
Feds to Open Tens of Thousands of Acres of Colorado Wilderness to Oil Drilling
-
 Deadly Dust: The Silicosis EpidemicMay 27, 2026
California Moves to Ban Quartz Countertop Fabrication to Combat Silicosis Epidemic
-
 Latest NewsMay 26, 2026
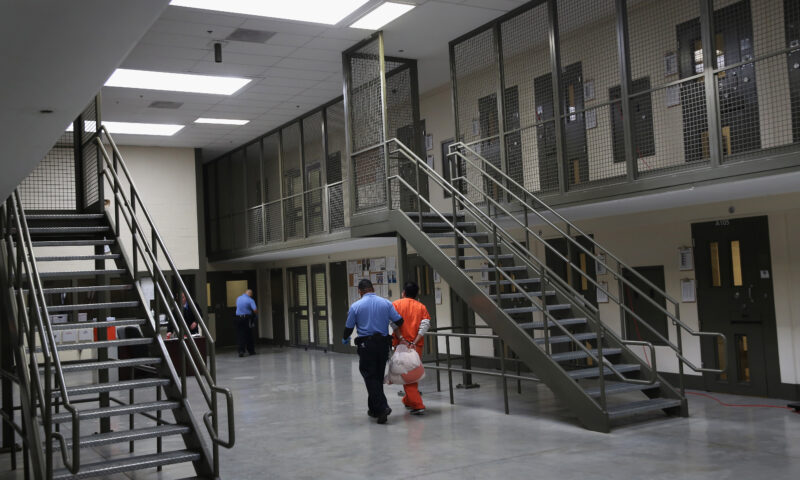
Conditions at California ICE Detention Centers Are Getting Worse, Inspections Find
-
 Imperial DivideJune 3, 2026
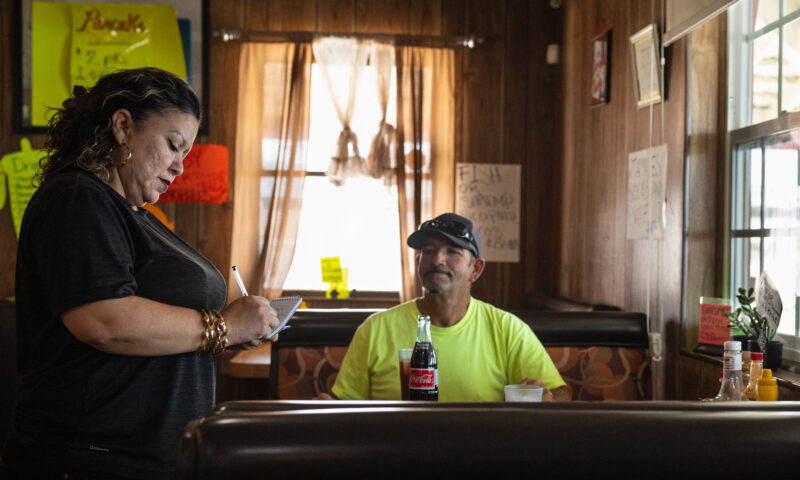
California’s Lithium Valley Dreams Meet Reality at the Only Restaurant in Town
-

 Column - State of InequalityMay 28, 2026
Top Democratic Candidates Agree on Housing Urgency, Not the Fix