
Labor & Economy
California Pensions: Encouraging News v. Scary Headlines

“California pension funds are running dry,” warned a recent Los Angeles Times headline.
“The unfunded liability— that’s the difference between promised benefits and projected funds to fulfill those obligations — grew from about $6.3 billion in 2003 to a little more than $198 billion in 2013,” Santa Rosa’s Press Democrat chimed in, helpfully doing the math to point out that’s a 30-fold increase in 11 years.
“The system, in short, is completely, utterly broken,” concluded the Orange County Register.
Despite nothing significant changing in the retirement plans themselves, public employee pensions are back in the news, and apparently panic is in the air.
Why? In late October State Controller John Chiang posted data on 130 state and local pension funds as part of his new By the Numbers website. The data aren’t new – they’re drawn from regularly required reports – but they are for the first time collected and easily accessible in a central location, as part of an effort by the Controller to increase transparency in government. However, the new appearance of existing numbers proved plenty of excuse for public sector pensions’ antagonists to launch their new round of alarm.
A Quick Guide to Pension Mechanics
A pension is a defined benefit plan, so called because the employer is guaranteeing a certain level of benefits to employees once they reach retirement.
In order to pay for those retirement benefits, a pension system needs to accumulate the funds required, which it does through contributions from the employer, contributions from the employees and investment of funds on hand. CalPERS, for example, touts that for every dollar paid out to retirees, 67 cents comes from investments, 21 cents from employer contributions and 12 percent from employees.
That mix can shift over time, though. Investments, by their nature, rise and fall. Employee contributions are usually set through a contract, though they may be adjusted by agreement, as some systems did to confront the recent recession. Employer contributions are set annually by actuaries who determine the anticipated costs or liabilities over time, the estimated value of assets over that time, and then set the amount employers will need to keep the system in balance (or as in recent cases, help move it gradually back into balance).[/box]
Pension funds are huge,[1] and we can only evaluate them against assumptions about tricky things like investment returns, inflation and life expectancy, all projected decades into the future. It’s not surprising that such a combination of size and the unknown is an effective fuel for fear. But is the panic warranted?
For his part, the Controller seems to see the state’s pension systems as a management challenge rather than a crisis. In a statement emailed to Capital & Main, Chiang said:
In the wake of the worst economic downturn since the Great Depression, the State’s pension systems are enjoying a rebound in investment earnings that has averaged over 12 percent during the past five years. But banking on greater investment returns, alone, is not a complete and sustainable solution. More needs to be done.
Steering the Ship
To some extent, managing a pension fund is like sailing a large ship across an ocean. A one-degree change in trajectory can add up to a few miles of difference on the far shore. Changes in wind and current push you one way or another, and you continually adjust using the tools you have to stay reasonably on target.
The largest sources of income for pension funds are investment returns. On the good side, that means most of the funding for pensions doesn’t come directly out of public budgets and employees’ pockets. In fact, as the market boomed in the 1990s, investment returns covered almost the entire funding requirements of some systems. The downside is that pensions’ primary piece of funding is at the mercy of the markets, which are not always booming.
When markets fall short, pension systems adjust and make up the gap over from the following years by recalibrating assumptions and increasing contributions from employers (and sometimes employees). This happened after the dot-com crash just over a decade ago. Indeed, as the By the Numbers data open with 2003, the large pension funds are experiencing the end of the dot-com crash and stabilizing.
To push our nautical metaphor, let’s say that at the turn of the century a storm blew us off course and we started working our way back over the next few years. Then in late 2007, we sailed into a hurricane.
Unfunded Liabilities: What’s the Damage?
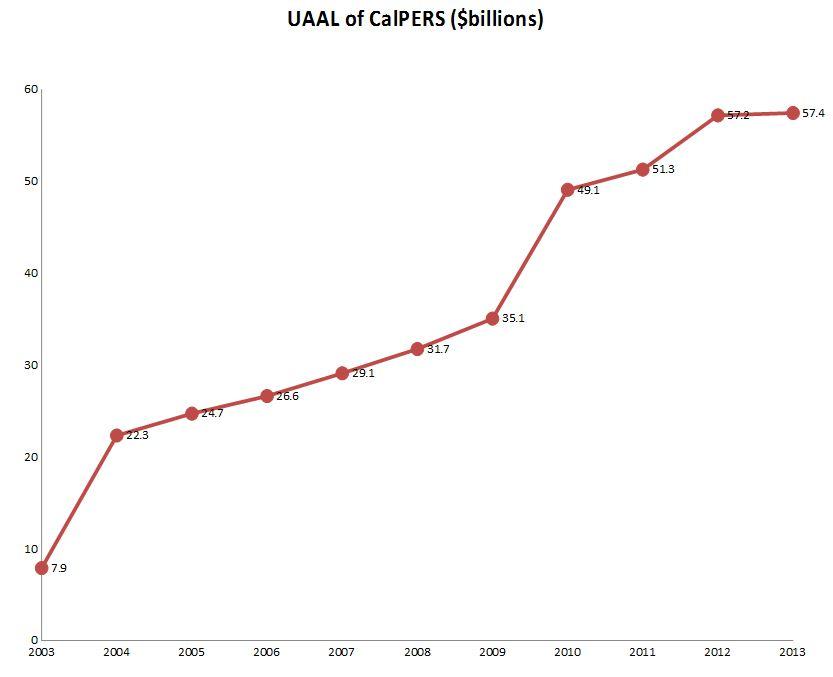
One of the main headline grabbers to come out of the Controller’s data involved the “unfunded liability” – and its seemingly unidirectional increase from 2003 through 2013, at which point the chart ends, so the viewer must proceed off the screen and into the future. (See below.) Media coverage like that cited above certainly help a reader along towards the conclusion that public employee pension funds are sailing off the edge of the world.
To some degree, the concern is warranted: the unfunded liability is indeed an important number. The Unfunded Actuarially Accrued Liability (UAAL) is a pension system’s best estimate of the amount by which its resources fall short of expected need. Such a shortfall will be addressed in part by increased contributions from the employer and, in the case of public budgets like these, that means costs to public budgets. In other words, given the economic hits taken by pension funds, the UAAL is a best estimate of the damages.
But taking a step back, the picture shaped by the decade of uninterrupted increase is tightly framed by the exact timeline included in the dataset – so it looks like a portrait of disaster. The impact we see reported by pension funds lags behind the current economy. This is in part due to the nature of accounting for investments, and in part due to the lag in reporting.
Take the state’s largest pension system, CalPERS,[2] as an example, for which the UAAL jumped from $7.9 billion in 2003 to $22.3 billion in 2004. At first sight, it would appear that there must have been some major jolt in those years, to triple the unfunded liability when the economy was booming (the Dow went up almost 28 percent between January 2003 and 2004). But the reporting date for each year is the previous June 30, so the change in those years is actually showing the tail end of the dot-com downturn. CalPERS was in such a strong position prior to that downturn, entering the new century with assets exceeding expected liabilities by $32.9 billion, that it wasn’t until the end of that downturn that CalPERS actually had an unfunded liability.
On the other end, the 2008 market crash and recession pushed the UAAL to $57.2 billion by 2012. In addition to the impact of investment losses, pension liabilities were amplified by public budget shortfalls. Hiring freezes and layoffs in state and local agencies meant that fewer active workers were paying into the system while more drew retirements. Strong returns in the chart’s final year nearly caught up to the liability increases, so the UAAL held fairly steady at $57.4 billion in 2013. When CalPERS releases its annual report in a few weeks, incorporating an 18.4 percent net rate of return for the last fiscal year, the UAAL will surely go down.
The upshot is that the 2003-2013 timeframe gives us UAAL charts that start on the left at nearly zero and shoot up – seemingly inevitably – to the right.[3] Historically, the UAAL has saw-toothed up and down, following the economy and markets. It was high in the early ’80s, improved until the recession in the early ’90s when it grew again, only to completely disappear in the late ’90s as the stock market boomed.
We should pay attention to the unfunded liabilities in California’s pension systems. We should be concerned with addressing them in a prudent way over the long term. However, we should not draw the conclusion – as do the critics of public employee pensions – that the last decade represents a one-way trend apart from the ups and downs of economic history, or that pension liabilities are on their way to swallowing California’s economy whole.
Funded Ratios: Are We Off Course?
One key indicator of a pension plan’s health is its funded ratio – that is, the percentage of a pension system’s future costs that can be covered by assets on hand or in the stream. If a pension plan has exactly enough resources to cover expected future costs, the funding ratio is 100 percent. If it had half the necessary assets on hand, a pension system would be 50-percent funded and that system’s managers would be making adjustments to close that gap over time.
There is no exact yardstick, but 80-percent funded is often considered a standard for a healthy pension system. Fitch Ratings has looked at a funded ratio of 70 percent or higher to be adequately funded, while Standard & Poor’s considers funded ratios of 80 to 90 percent as “above average.”[4] Obviously 100 percent is the goal, and the farther from that goal, the more work and resources will be required to get there.
Historically, funded ratios have moved up and down with investment returns as well as changes in pension systems. In contrast to the end-is-nigh commentary on the current state of pensions, funding was much worse 30 and 40 years ago. A Standard & Poor’s report notes that the average funded ratio of state pensions was just 51 percent in 1975, improved with better accounting standards in the late 1980s, then topped out over 100 percent with the investment boom of the 1990s before falling since.[5]
There is a wide range among the systems in the Controller’s data set. But zeroing in on the largest funds, most are right around the 80-percent mark. (See table below.) Only one lags below 60-percent funded.[6] Not perfect, but not seriously unhealthy, either.
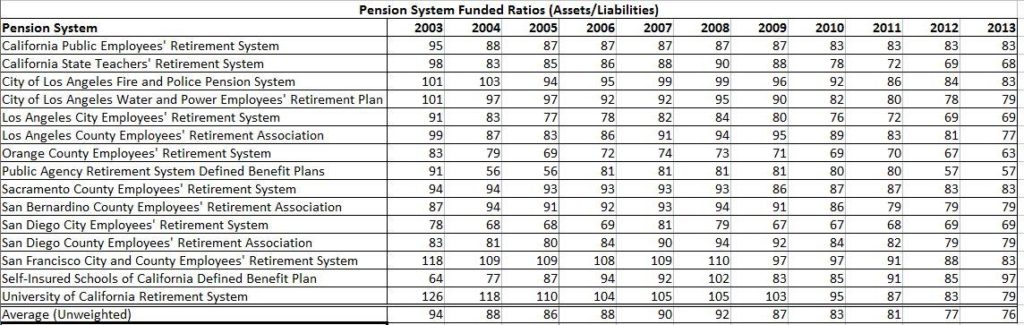
Numbers are funded ratios (in percentages) for California’s largest state, county, and city agency pension funds. From bythenumbers.sco.ca.gov.
Click table to enlarge
The two economic hits – the dot-com crash and the Great Recession – can again be seen in this data, as most of the pension systems start out in excellent positions, falling in the first year as the end of the first downturn works through the systems. They are then stable and starting to increase slowly through the middle of the decade, before the recession hits, leading to a slide from 2008 to 2013. Only by the end of that run are more than a couple of the funds down below the 80-percent mark, and as we noted with CalPERS above, we may soon see that things have started to turn for the better when 2014 data arrive.
The Moody’s credit rating agency seems to agree that the funds are in decent shape and recovering, improving CalPERS and CalSTRS (California State Teachers’ Retirement System) ratings to Aa2 this year due to the improving economy and sound management decisions.
So Should We Panic?
To be sure, California’s pension systems have taken an expensive hit, with a hurricane of a market crash following just a few years after the turn-of-the-century recession. This has been the story of pensions over the last few years, and the Controller’s new data site again shows the impact of the twin recessions clearly. Pension funds that had previously been strong fell behind. There have been and will continue to be budget costs, but the outlook is improving.
Controller Chiang credits some prudent decision-making with helping to improve pension systems’ outlooks, though he cautioned in his email to Capital & Main that it’s not all smooth sailing yet:
Importantly, state lawmakers have moved the discussion in the right direction by enacting pension reforms that are projected to save between $42 billion and $54 billion for all state, school and local agency CalPERS plans over the next 30 years. Likewise, CalSTRS’s unfunded liability is projected to be erased within the next three decades as the result of a legislative compromise requiring the State, teachers and local school district employers to increase their pension contributions.
However, until those savings are fully realized, California and its local communities will continue to wrestle with how to responsibly manage the unfunded liabilities associated with providing retirement security to police, firefighters, teachers and other providers of critical public services.
California’s pension systems fell into a deep rut, it’s true, but it’s a challenge that Californians can manage our way through.
In the meantime, California may indeed be running dry. But its major pension funds are not.
[1] The defined benefit systems in the Controller’s By the Numbers data cover more than 2.1 million active employees and more than 1.2 million retirees.
[2] The California Public Employees’ Retirement System, or CalPERS, manages retirement benefits for state workers as well as local governments, school districts and other employers. With 1.6 million members, it’s the country’s second-largest pension fund after the federal government’s main system.
[3] This is the shape graphs take when they broadcast the inevitable.
[4] A methodology document from Fitch Ratings explains that “Fitch generally considers a funded ratio of 70 percent or above to be adequate and less than 60 percent to be weak, while noting that the funded ratio is one of many factors considered in Fitch’s analysis of pension obligations.”
[5] In its 2013 report on public pensions, Standard & Poor’s Ratings Service traces a brief history of pension funded ratios:
Most state governments have a long-term track record of making adjustments and improving funding ratios. […] According to a Federal Reserve study, in 1975 the aggregate funded ratio of public pensions for states was 51 percent. However, as Baby Boomers reach retirement age, and given increased longevity, the risks from weaker funded ratios are higher now than they were in the 1970s.
State pension funded ratios made what we consider strong gains in the 1990s, climbing to funded ratios above 100 percent by 2000, compared with approximately 80 percent a decade earlier. Above-average investment returns, particularly from equities, contributed to this rapid increase. […]
During the past decade, however, the funded ratio trend shifted quite rapidly when public pension funds suffered a number of setbacks, including two recessions.
[6] The Public Agency Retirement Services, or PARS, is a private firm that administers retirement programs for public agencies that contract with it. It is a competitor to the state-owned CalPERS, though each serves many public employers in California.


-

 Column - State of InequalityMay 21, 2026
In California Governor’s Race, Xavier Becerra Walks Away From Single-Payer
-

 Latest NewsMay 22, 2026
Where California’s Gubernatorial Candidates Stand on Climate and Taking Big Oil Money
-

 The SlickMay 29, 2026
Feds to Open Tens of Thousands of Acres of Colorado Wilderness to Oil Drilling
-

 Deadly Dust: The Silicosis EpidemicMay 27, 2026
California Moves to Ban Quartz Countertop Fabrication to Combat Silicosis Epidemic
-
 Latest NewsMay 26, 2026
Conditions at California ICE Detention Centers Are Getting Worse, Inspections Find
-

 Imperial DivideJune 3, 2026
California’s Lithium Valley Dreams Meet Reality at the Only Restaurant in Town
-

 Column - State of InequalityMay 28, 2026
Top Democratic Candidates Agree on Housing Urgency, Not the Fix
-

 Latest NewsJune 1, 2026
Deep Cuts to Civilian Support Staff for Families of Deployed Marines Raise Concerns